Vernier Graphical Analysis GW Android 用の
- REQUIRES ANDROID | カテゴリ: Education
評価 2.42675
から 157 投票 |
$ Free
- REQUIRES ANDROID | カテゴリ: Education
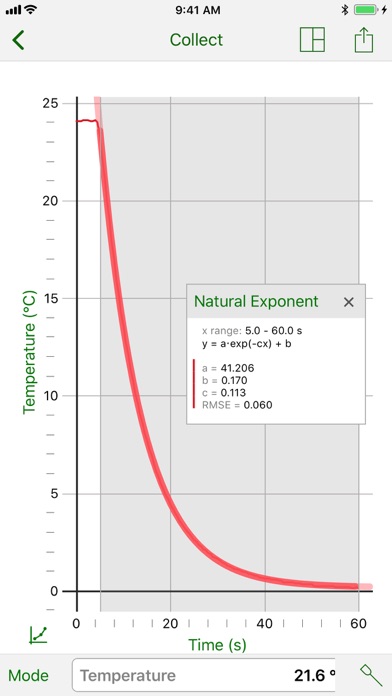
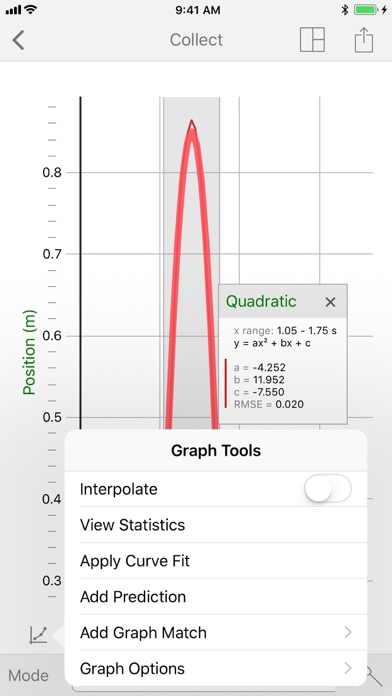
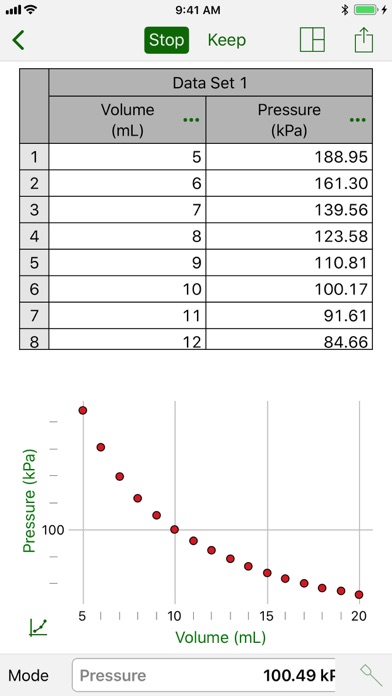
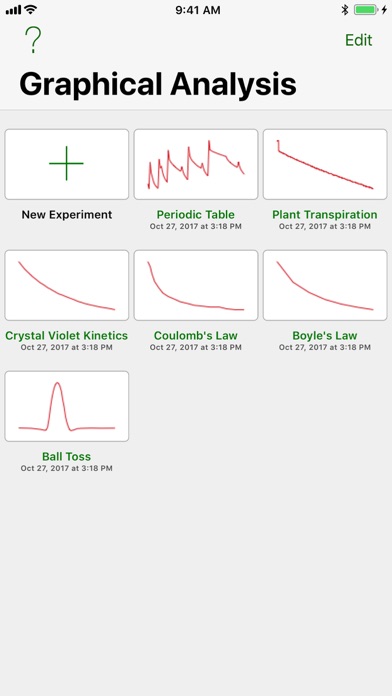
Graphical Analysis™ GW is a tool for science students to collect, graph, and analyze data from Vernier Go Wireless® sensors. Sensor data-collection support: • Vernier Go Wireless® Temp and Go Wireless pH sensors • Vernier Go Wireless Heart Rate and Go Wireless Exercise Heart Rate monitors • Vernier LabQuest® sensors used with Go Wireless Link or LabQuest Stream interfaces • Basic support for some Vernier Go Direct® Sensors • NODE (by Variable Inc.) sensor support Additional experiment options: • Data Sharing via Wi-Fi connection to LabQuest 2 or Logger Pro® 3 • Built-in Sensors (accelerometers) • Manual Entry Note: Sensor data collection and Data Sharing require the purchase of hardware from Vernier Software & Technology. Built-in sensor and manual entry of data can be performed without a hardware purchase. For more information on Data Sharing, visit http://www.vernier.com/css Key Features - Data Collection • Multi-sensor data-collection support • Time Based, Event Based, and Drop Counting data-collection modes • Configurable data-collection rate and duration for time-based data collection • Sensor calibrations • Option to zero and reverse sensor readings • Graph match feature for use with motion detectors • Manual entry of data from keyboard and clipboard Key Features - Data Analysis • Display one, two, or three graphs simultaneously • View data in a table or show a graph and table side-by-side • Draw Predictions on a graph to uncover misconceptions • Examine, interpolate/extrapolate, and select data • Apply Statistics calculations to find mean, min, max, and standard deviation • Perform curve fits, including linear, quadratic, natural exponent, and more • Add calculated columns based on existing data to linearize data or investigate related concepts • Pinch to scale graphs Key Features - Collaboration and Sharing • Add graph titles • Export graphs and data for printing and inclusion in lab reports • Export data in .CSV format for analysis of data in spreadsheet software such as Excel®, Google Sheets™, and Numbers® Vernier Software & Technology has over 35 years of experience in providing effective learning resources for understanding experimental data in science and math classrooms. Graphical Analysis GW is a part of the extensive system of sensors, interfaces, and data-collection software from Vernier for science and STEM education.
 |
 |
 |
 |
APK (Android パッケージ キット) ファイルは、Android アプリの生のファイルです。4 つの簡単な手順で vernier-graphical-analysis-gw.apk ファイルを携帯電話にインストールする方法を学びます:
はい。Vernier Graphical Analysis GW APK を入手するための最も安全な Apk ダウンロード ミラーを提供しています。

|

|
|

|

|

|

|
|

|

|